Shandong Fengtu IOT Technology Co., Ltd
Sales Manager:Ms. Emily Wang
Cel,Whatsapp,Wechat:+86 15898932201
Email:info@fengtutec.com
Add:No. 155 Optoelectronic Industry Accelerator, Gaoxin District, Weifang, Shandong, China


Sales Manager:Ms. Emily Wang
Cel,Whatsapp,Wechat:+86 15898932201
Email:info@fengtutec.com
Add:No. 155 Optoelectronic Industry Accelerator, Gaoxin District, Weifang, Shandong, China
Model:FT-NQ14
Brand:fengtu
1.Agrometeorological stations product introduction
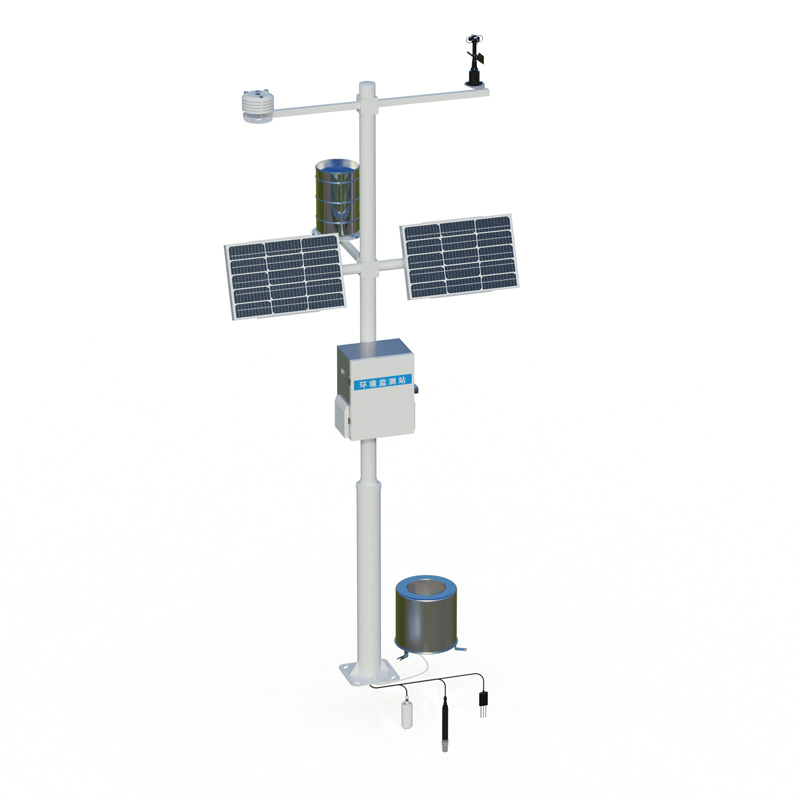
Agrometeorological stations can monitor the farmland environment all weather, including temperature, humidity, wind speed, wind direction, rainfall and many other meteorological elements.NQ14 Agrometeorological stations is a highly integrated, low-power, fast installation and easy for field monitoring.
The device consists of five parts: meteorological sensor, collector, solar power supply system, pole support, and cloud platform.It is free of debugging and can be quickly arranged, and is widely used in meteorological, agriculture, forestry, scientific investigation and other fields.
2.Product features of Agrometeorological stations
1.Low-power collector: static power consumption is less than 1mA
2.Standard GPRS networking, support extended Bluetooth, and wired transmission
3.Seven-inch Android touch screen, version: 4.4.2, quad-core Cortex™-A7, 512M/4G
4.Support modbus485 sensor expansion
5.Solar Charging Management MPPT Automatic Power Point Tracking
6.Three-meter carbon steel bracket, two threaded screw connection
7.Send SMS alarm, send SMS to the specified mobile phone after exceeding the limit
8.Stainless steel material protective box, corrosion-resistant and oxidative-resistant, waterproof grade IP66
3.Technical parameters of Agrometeorological stations
1.Collector power supply interface: GX-12-4P, input voltage 8-16V, with RS485 output json data format
2.Sensor modbus, 485 interface: GX-12-4P plug, output power supply voltage 12V/1A, device configuration interface: GX-12-4P plug, input voltage 5V
3.Solar power supply and equipped with lead-acid battery, optional 30W 20AH/50W 20AH/100W 100AH.Charging controller: 150W, MPPT automatic power point tracking, efficiency is increased by 20%.
4.Data upload interval: 1 minute-1000 minutes adjustable
5.Screen size: 1024*600 RGB LCD
6.Some sensor parameters
| name | Measurement range | Resolution | Accuracy |
| Ambient temperature | -40~+80℃ | 0.01℃ | ±0.3℃ (25℃) |
| Relative humidity | 0~100%RH | 0.01%RH | ±3%RH (20%~80%) |
| Light intensity | 0-157286LUX | 1Lux | <±3% |
| Atmospheric pressure | 300-1100hpa | 0.1hPa | ±0.25% |
| Dew point temperature | 0~+70℃ | 0.1℃ | ±1℃ |
| Tube soil temperature | -30~+70℃ | 0.01℃ | ±0.3 (-10~70℃) |
| Tube soil moisture | 0~100% | 0.1% | ±3% |
| Tube Soil Salt | 0~20000us/cm | 1us/cm | ±3 (0~10000us/cm) ±5% (full range) |
| Soil PH (electrode method) | 0-14PH | 0.01 | ±0.1PH |
| Soil nitrogen, phosphorus and potassium | 0~1999mg/kg | 1mg/kg | ±2% |
| Soil evaporation | 0~75mm | 0.1mm | ±1% |
| wind direction | 0~360° (8 directions) | 1/8 | <3°(>1.0m/s) |
| Wind speed | 0~30m/s | 0.1m/s | ±(0.2+0.03V) m/s (25℃, V indicates wind speed) |
| rainfall | ≦4mm/min | 0.2mm | ≤±2% |
| Ultraviolet radiation | 0~500W/㎡ | 0.01W/㎡ | ≤±3% |
| Sunshine hours | 0~6500h | 0.1h | <0.2h |
| Total photoelectric radiation | 0-2000W/m2 | 1W/m2 | <±3% |
| Photosynthetic effective radiation | 0-2000W/m2 | 1W/m2 | ≤±5% |
| carbon dioxide | 400-5000ppM | 1ppM | ±(50ppm+5% reading |
| PM2.5 | 0-1000ug/m³ | 1ug/m³ | ±10% (<500 micrograms) |
| PM10 | 0-1000ug/m³ | 1ug/m³ | ±10% (<500 micrograms) |
| Carbon monoxide | 0-1000ppm | 1PPM | ±2PPM |
| Sulfur dioxide | 0-20PPM | 0.1PPM | ±1PPM |
| Nitrogen dioxide | 0-20PPM | 0.1PPM | ±1PPM |
| ozone | 0-20PPM | 0.1PPM | ±1PPM |
| Negative oxygen ions | 0~100,000 units/cm3 | 1/cm3 | Reading ±10%; ion mobility ≤±20% |
| Oxygen content | 0~25%Vol | 0.1% | ±3%FS |
4.Agrometeorological stations cloud platform
1.CS architecture software platform, supports direct observation of mobile phones and PC browsers without additional software installation.
2.Support multiple accounts and multiple devices to log in
3.Support real-time data display and historical data display dashboard
4.Cloud server and cloud data storage are stable and reliable, easy to scale, and load balancing.
5.Support SMS alarm and threshold settings
6.Support map display and viewing device information.
7.Support data curve analysis
8.Support data export table form
9.Supports data forwarding, HJ-212 protocol, TCP forwarding, http protocol, etc.
10.Support data post-processing function
11.Support external running of javascript scripts
agricultural sensors are used to detect information about the growing environment of agricultural crops, such as air temperature and humidity, light intensity, carbon dioxide and other data required for field cultivation....
The weather environment monitor is a high-tech device used for real-time monitoring of various meteorological elements in the atmospheric environment, mainly used in the fields of weather forecasting, climate change research, environmental monitoring, agricultural production and so on. It can help u...
sensors on roads collect road traffic information, monitor road conditions, weather conditions, ice, snow and water on the road surface, and improve road safety....
The quality of the atmospheric environment is closely related to the survival and development of human beings. Precise and real-time monitoring serves as the foundation for understanding the state of the atmospheric environment and formulating control measures. As important tools for atmospheric env...


 Get a Free Quote
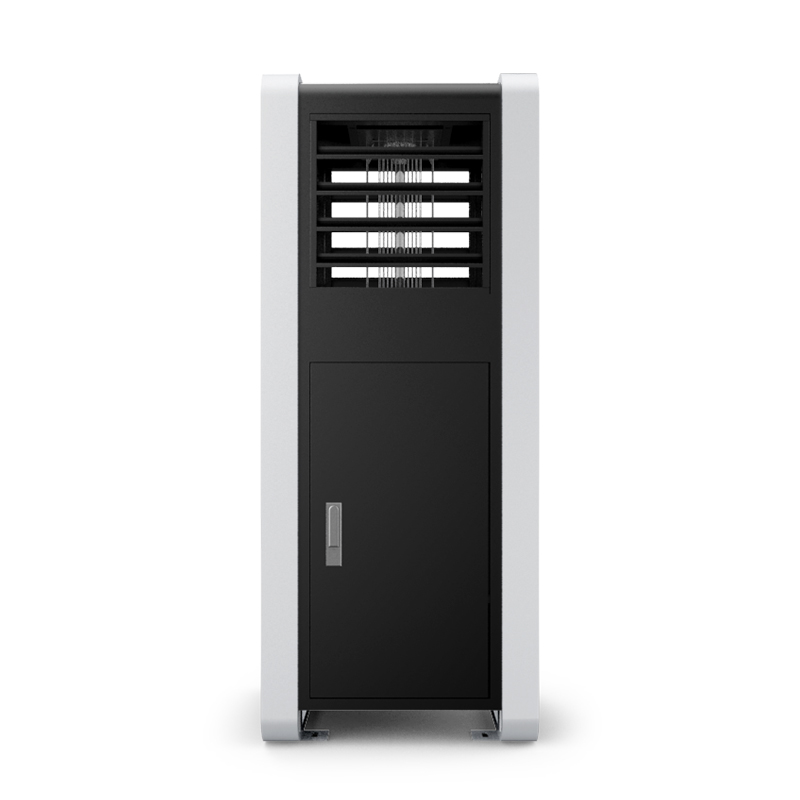
 Skype
Skype
 whatsapp
 mail
mail