Shandong Fengtu IOT Technology Co., Ltd
Sales Manager:Ms. Emily Wang
Cel,Whatsapp,Wechat:+86 15898932201
Email:info@fengtutec.com
Add:No. 155 Optoelectronic Industry Accelerator, Gaoxin District, Weifang, Shandong, China


Sales Manager:Ms. Emily Wang
Cel,Whatsapp,Wechat:+86 15898932201
Email:info@fengtutec.com
Add:No. 155 Optoelectronic Industry Accelerator, Gaoxin District, Weifang, Shandong, China
time:2025-04-07 09:47:45 source:Weather Station viewed:862 time
On the technical specification sheet of each photovoltaic (PV) module, an "IV curve diagram" is attached. What exactly is this? In fact, it is a current-voltage curve diagram, which is a characteristic curve used to describe the relationship between the output current and output voltage of a PV module under different lighting conditions and loads.
The IV curve diagram usually appears as a curve starting from the origin. The horizontal axis represents the voltage (V), and the vertical axis represents the current (I). As the voltage increases, the current remains relatively stable first and then drops sharply. This shape is derived from the superposition effect of the diode characteristics of the photovoltaic cells and the photo-generated current.
It shows the relationship between the current and voltage of the PV module under different operating conditions and is an important basis for evaluating the performance of the module.
There are several key parameters included in the IV curve diagram:
Short-circuit current (Isc), which is the current value when the output terminal of the module is short-circuited, corresponding to a voltage of zero.
Open-circuit voltage (Voc), which is the voltage value when the load resistance of the module is infinite, corresponding to a current of zero.
Maximum power point (MPP), which is the operating point where the module has the maximum output power, usually located at the "knee" position of the curve.
The power generation efficiency and performance of the PV module can be evaluated through the IV curve to check if they meet the standards. When there is a deviation between the actually measured IV curve and the standard curve, it may indicate that there are performance problems with the module, such as shadow obstruction, damage to the solar cells, or failure of the bypass diodes.
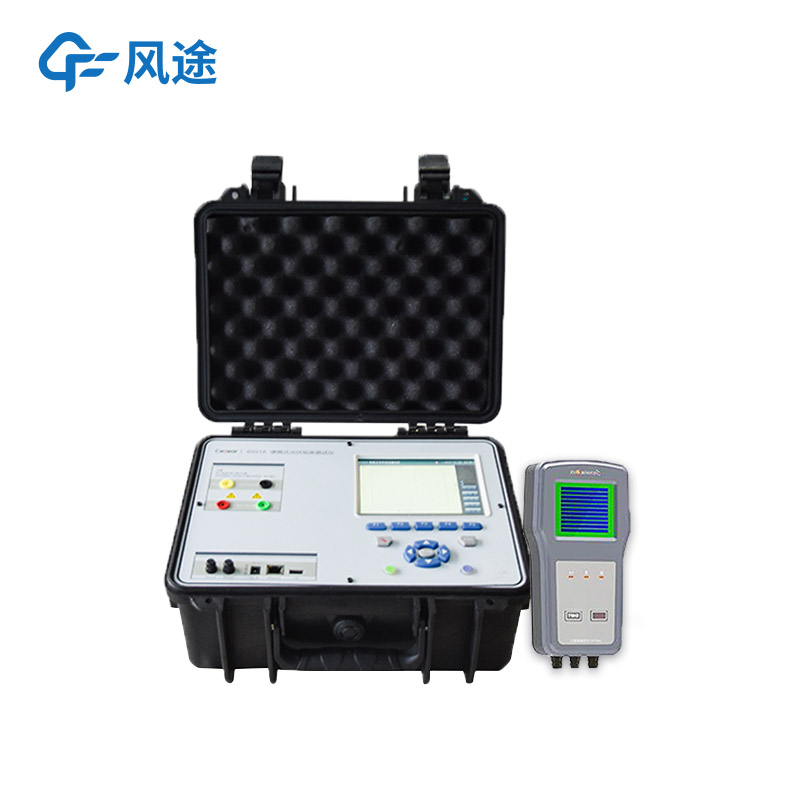
The I-V Curve Tracer draws the IV curve by applying different voltage values to the PV module and measuring the corresponding current output. This curve can intuitively show the current response characteristics of the PV module at different voltages, providing an important basis for performance evaluation, quality control, and fault diagnosis. When the tester is in operation, it is necessary to apply a continuous variable to the PV module and respond quickly to obtain an accurate IV curve diagram. Multiple measurements also need to be carried out to eliminate errors, and the test results should be compared with the standard curve to ensure the accuracy of the test results.
water level detection is used to detect the level of moveable substances and can be used to accurately determine the level of water in tanks, ponds, rivers or any other body of water....
The photoelectric rain gauge is a rain detector based on the optical principle, which utilizes changes in light signals to measure rainfall. It is a relatively new rainfall detection technology with the advantages of high accuracy, fast response and reliability.The working principle of the optical r...
The water regime monitoring system is applied to the water conservancy management department to remotely monitor the water level and rainfall of the reservoir and collect real-time data, and provide accurate, timely and automatic on-site monitoring information to ensure the safe operation and manage...
Water is the most basic and important resource, and the quality of water sources is directly related to people's health. However, the development of industrial society has brought severe water pollution problems. Water quality monitoring from the source to the tap has become the core of ensuring...


 Skype
Skype
 whatsapp
 mail
mail